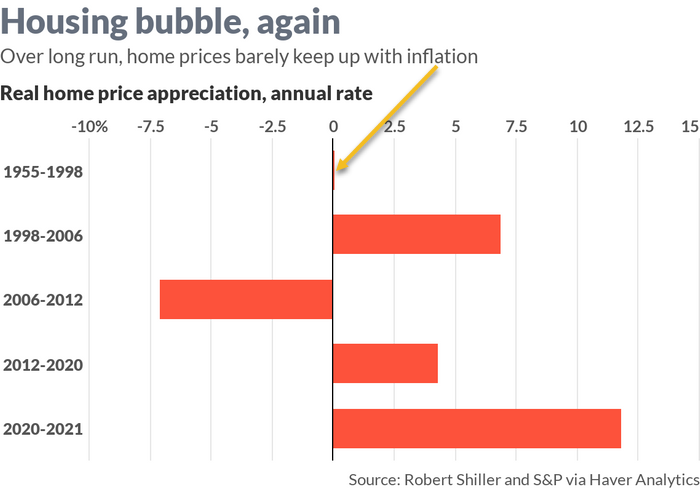
The way I see this chart is 1955-1998 homes prices increased just .1% over inflation.
Then you have a nice increase from 1998 to 2006, but then it is offset by the decline from 2006 to 2012.
Since 2012 it has been rising, and especially this last year.
Over time, home prices can’t grow much faster than household incomes, so it seems at some point it will have to decline again.