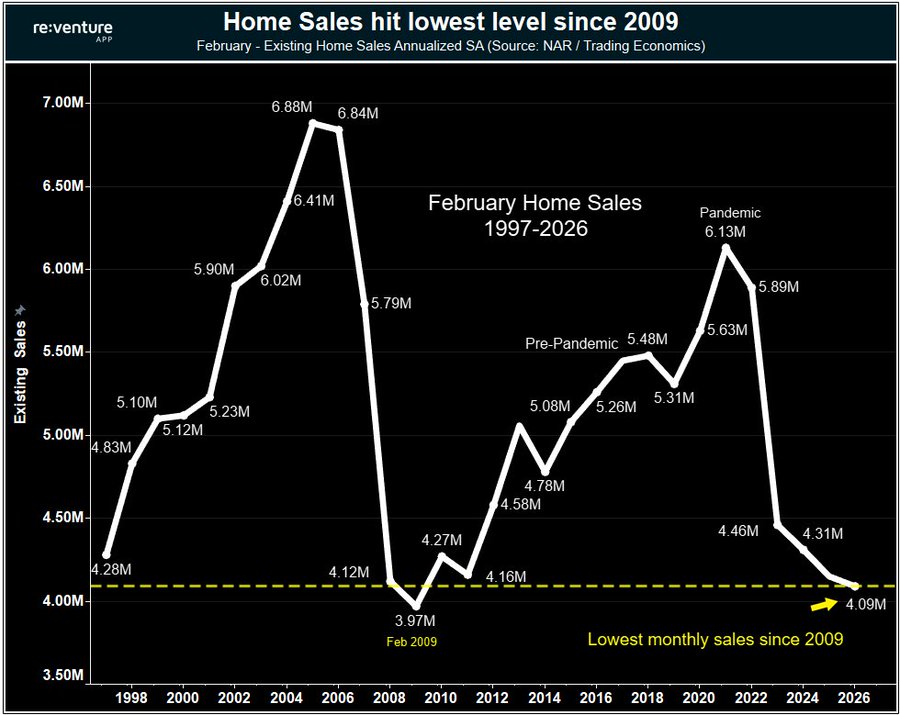
The latest data shows that existing home sales have plunged to an annualized rate of 4.09 million, nearly matching the lows of February 2009. For those who remember the Great Financial Crisis, that year represents the “bottom” of the most significant housing crash in modern history. Back then, the market was flooded with foreclosures and “underwater” mortgages due to predatory lending and a massive oversupply of homes. Today, the chart looks eerily similar, but the “why” behind the numbers is fundamentally different.
Why is it so bad right now?
While the 2008 crash was caused by too many houses and bad debt, the 2026 “freeze” is being driven by a combination of factors that have effectively paralyzed both buyers and sellers:
- The “Lock-In” Effect: Millions of homeowners are sitting on mortgage rates between 2.5% and 4%. With current rates hovering around 6.2%, many people simply cannot afford to sell and move into a new home that would double their monthly interest payment.
- The Affordability Ceiling: Even as price growth stalls, the combination of high prices and elevated interest rates has created a “buyer’s strike.” Many would-be homeowners have been priced out entirely, leading to the lowest sales volume in nearly two decades.
- Inventory vs. Demand: Unlike 2008, we aren’t seeing a massive glut of forced sales. Instead, we have a “standoff.” Sellers don’t want to give up their low rates, and buyers can’t afford the new ones.
Is a Crash Coming?
History suggests that when sales volume stays this low for this long, something eventually has to give. In 2008, the “give” was a collapse in prices. Today, we are seeing a slower “price discovery” phase. While we might not see a 2008-style “crash” due to stricter lending standards and low foreclosure rates, the chart clearly shows we are in a period of historic market contraction. For the market to move again, either rates need to drop significantly, or prices must adjust to meet the reality of today’s buyers.